Climate Change
Analysis, Visualisation, Dashboard
Date: 2015-11-30 |
Link: BR |
Analysis: GitHub |
Language: German |
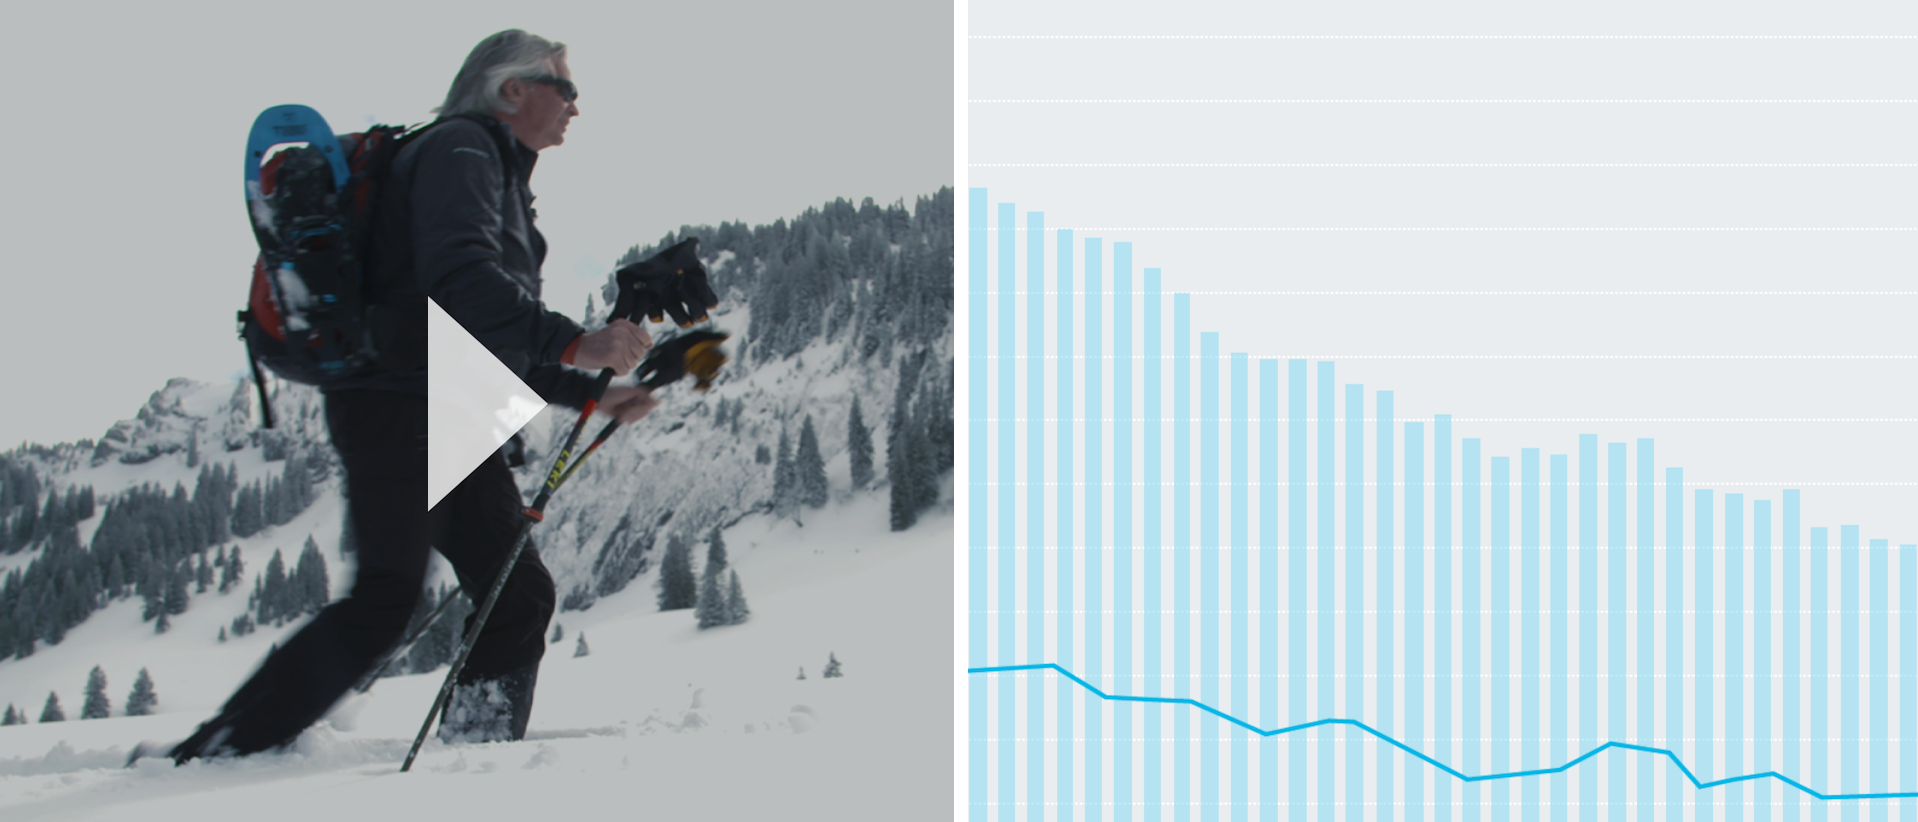
We examined climate change in the German part of the Alps and how the local tourism industry copes with it. The story consists of videos with long sequences of animated data. Besides, an interactive dashboard enables the user to take a look at the situation in particular municipalities. We aggregated data from stations provided by the German Meteorological Service and calculated trends over the last 50 years.
